Sometimes the level of need around the world is so overwhelming, it is difficult to believe that the body of Christ has incredible potential to meet many of these needs in Jesus’ name.
As described in our research, church member giving is declining as a portion of income, and was 2.17% in 2016. The figure below shows what could happen if giving went up to an average of 10%.
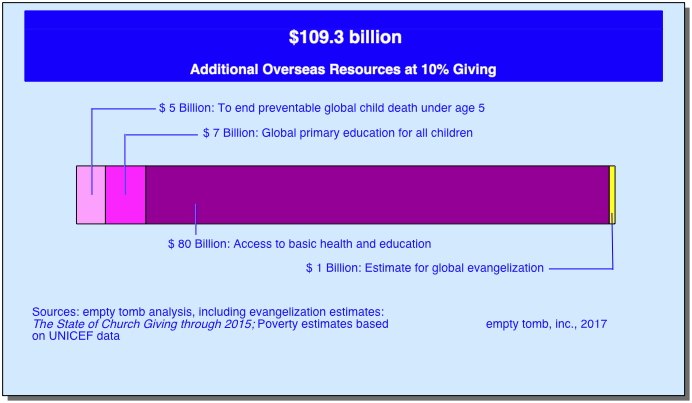
If Americans who identify with the historically Christian church had chosen to give 10% to their congregations in 2016, rather than the 2.17% given that year, there would have been an additional $172 billion available for work through the church. 1 If those members had specified that 60% of their increased giving were to be given to international missions, there would have been an additional $109.3 billion available for the international work of the church. That would have left an additional $36.4 billion for domestic missions, including poverty conditions in the U.S., 2 and this all on top of our current church activities.
One source estimates that an additional $70 to $80 billion a year could address the basic needs of the poorest people around the world. 3 Additionally, $5 billion a year 4 could end the estimated 5.9 million children under five dying around the globe each year. 5
Basic primary education for all children around the globe would cost $7 billion a year. 6 If the total cost of evangelization were to be estimated, including not only expanded but also ongoing work, the increased total might not exceed $1 billion a year. 7
Even if money were available for outreach, you may still wonder if positive global change is possible. The following graph indicates the progress made in the areas of child deaths, life expectancy, literacy, and unreached people groups over the last several decades. As an aside, demographic experts have noted that birth rates tend to go down when child death rates decline. Experts now believe that child death rates need to be addressed in order to tame world population growth.
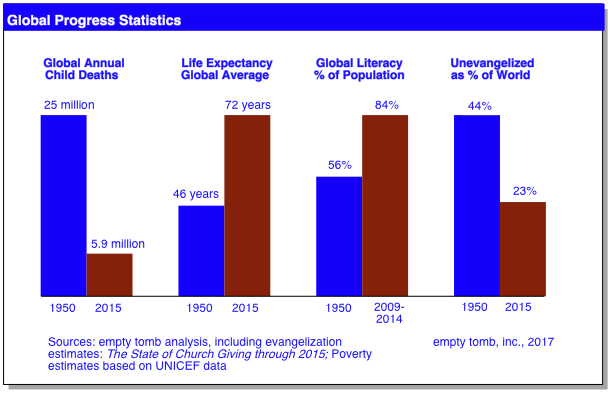
The Joshua Project focuses its efforts on research and information dissemination about [unreached people groups]. The Joshua Project noted on its Web site: “After almost twenty centuries, about 28 percent of the world’s population is still unreached… Trends show us that if we continue to do things as we are doing them, the unreached will still be at least 23% of the world by 2050.” 8
Progress is possible. And with the potential resources that could be available, even greater things can happen. At the same time, it also serves as a warning that we can’t take this progress for granted. We can make a difference—if we decide to act.
1 The basis for the calculations of potential giving by historically Christian churches in the U.S. in 2016 is as follows. In chapter seven of this volume titled “Why and How Much Do Americans Give?,” a 2016 figure of total giving to religion was presented in the “Denomination-Based series Keyed to 1974 Filer Estimate.” That figure was $68.3 billion. A figure of 73.8% was multiplied by the 2016 figure for giving to religion of $68.3 billion to determine what amount was given by those who identify with the historically Christian church. The result was $50.4 billion . In 2016, if giving had increased to an average of 10% from the actual level of 2.17% given, instead of $50.4 billion , an amount of $232.6 billion [p.87, fn2] would have been donated to historically Christian churches. The difference between the $50.1 billion given and the potential of $232.6 billion [p.87, fn2] is $182.2 billion, the additional money that would have been available at an average of 10% giving. The above figure of 73.8% was based on an empty tomb, inc. analysis of data published in Barry A. Kosmin and Ariela Keysar; American Religious Identification Survey [ARIS 2008] Summary Report; Hartford, Conn.: Trinity College, March 2009; p. 5 of 7/4/2009 printout, and referred to that portion of the U.S. population that identifies with the historically Christian church—those communions and traditions, such as Roman Catholic, Orthodox, evangelical and mainline Protestant, Pentecostal, and Anabaptist, that profess a commitment to the historic tenets of the faith. See John and Sylvia Ronsvalle, The State of Church Giving through 2016: What (Champaign, IL: empty tomb, inc., 2016), Chapter 6, p. 65.
2 It may be noted that the estimate of an additional $182.2 billion that would be available if average giving were at 10% is at the lower end. Rather than using the calculation detailed in the previous endnote, two other estimates of $753 billion and $947 billion for 2016 were obtained based on alternate assumptions.
An alternative estimate of $693.4 billion was derived based on the assumption that: (1) 59.45% of Americans are members of historically Christian churches, with aggregate after-tax income of $9.98 trillion ; (2) religious giving was $68.3 billion in 2016 ; and (3) 73.8% of religious giving was from self-identifying Christians (estimate based on ARIS 2008). The results indicated that the giving level among self-identifying Christians was 0.63% of historically Christian church member after-tax income in 2016, rather than the 2.17% noted in the previous endnote. In that case, the difference between 2016 giving at 0.63% and 10% would have been $753.3 billion.
Alternatively, one could base the potential giving level calculation on the assumptions that: (1) 73.8% of Americans identify with the historically Christian church, whether or not they are members (estimate based on ARIS 2008); (2) this portion of Americans had an aggregate after-tax income of $9.98 trillion ; and (3) the calculation considered contributions as possibly available from this 73.8% of U.S. population. Giving levels would then have been at the 0.51% of income level. In that case, the difference between self-identified Christian giving in 2016 at the 0.51% level and a potential 10% level would have yielded an additional $947.3 billion in 2016. The estimate of 59.45% church member figure was an empty tomb, inc. calculation based on Gallup, Religion in America 2002, pp. 28, 40. The 2016 aggregate Disposable Personal Income figure of $13.51 trillion that was multiplied by the church member population figures in the two alternative calculations contained in this endnote above was obtained from U.S. Bureau of Economic Analysis National Income and Product Accounts, Table 2.1, Personal Income and Its Disposition, line 26, data published 3/27/2016. For further discussion, see Chapter 6, The State of Church Giving through 2016, including p. 27.
3 Carol Bellamy, The State of the World’s Children 2000 (New York: UNICEF, 2000), p. 37. [p.65, fn4]
4 James Grant,The State of the World’s Children 1990 (New York: Oxford University Press, 1990), p. 16, [p.66, fn 8] estimated that $2.5 billion a year would be needed by the late 1990s to stop preventable child deaths. An updated figure of $5.1 billion was cited in Jennifer Bryce, et al.; “Can the World Afford to Save the Lives of 6 Million Children Each Year? [Abstract]“; The Lancet, vol. 365; 6/25/2005; p. 2193;
5 The State of the World’s Children 2016: A Fair Chance for Every Child (New York: UNICEF, 2016), p. 109 [p.65, fn5]
6 The State of the World’s Children 2016: A Fair Chance for Every Child (New York: UNICEF, 2016), p. 109. [p.65, fn6]
7 John Ronsvalle and Sylvia Ronsvalle, The State of Church Giving through 2005: Abolition of the Institutional Enslavement of Overseas Missions (Champaign, IL: empty tomb, inc., 2008), pp. 66-67.
8 Unreached Peoples’ Advocate; Spring 2010 Vol. 13, No. 1; p. 1 of 5/20/2010 printout, as quoted in The State of Church Giving through 2013, p. 126.
Source for the figure of 4,891,000 child deaths in 2022 that is used in the Counter for 2024: United Nations Inter-agency Group for Child Mortality Estimation; Child Mortality Report 2023; https://childmortality.org/wp-content/uploads/2024/03/UN-IGME-2023-Child-Mortality-Report.pdf; p. 11 of 3/16/2024 download, 6/11/2024 printout.
©2001–2023 empty tomb®, inc. All rights reserved.For information on citing the copyrighted materials of this site, please see the empty tomb, inc. Trademark and Copyright Information page. The contents of this web site pertaining to the works and name of works of empty tomb, inc., including but not limited to, Christian Family to Family Relationships, Christian Health Services, Clothing Work, Free Food Work, Furniture Work, Helping Work, Home Maintenance Work, The National Money for Missions Program (NMMP), Mission Match, Wake the Sleeping Giant, and Discipleship Tree are property of empty tomb, inc. Additionally, the Yoking Map, in name or in concept, as well as the faces of the children of the world, may not be used or reproduced, stored, or transmitted in any form without prior expressed written permission of empty tomb, inc. The opinions and philosophies of the web sites to which this empty tomb site has linked are those of their authors and not necessarily shared by empty tomb, inc.empty tomb®, inc.